Run a product sales report
A product sales report helps you track your sales by displaying the aggregated information on your sales and returns for different stock-keeping units (SKUs). It also includes a detailed breakdown of all sold and returned items with additional metrics. You can initiate a product sales report through the Dashboard in your web browser, in the GoDaddy Commerce app or on your GoDaddy Smart Terminal.
- Sign in to the Dashboard where you manage your GoDaddy Payments account (use your GoDaddy username and password).
- Select Reports.
- Select Product Sales Report.
- In the Type dropdown menu, ensure that Items Report is selected.
- In the Start and End fields, specify the date range for the report.
- Select Generate to pull your report. (This can take a few minutes.)
- You'll receive an email notification when the report is ready. Select the link in the email to return to Reports. The report will appear below your filter selections.

- Select the report to review a summary and breakdown of itemized orders for the selected time period. You can also adjust the report format depending on how you want to use the data:
- To download the report in Excel, select Excel. You can filter the report data in Excel by different variables (for example, transactions processed by a specific employee).
- To download the report in PDF format, select PDF (if available).
- Use the filters above the report list (under Report History) to locate a previously generated report based on the report type and/or the date the report was generated.
- From your smart terminal home screen, tap Settlements or Deposit.
- Tap Reports in the lower-right corner.
- Tap Generate Report.
- In the Type dropdown menu, tap Product Sales.
- In the Start date and End date fields, specify the date range for the report.
- In the Employee field, tap a specific employee. Or – leave the field as All employees to run a complete report of every transaction in that date range.
- Tap Generate to pull your report.
- When the report is ready, it will appear on your smart terminal screen. Tap View to open and review it.
Note: Reports created on the smart terminal will also display in your web browser Dashboard under Reports. Access them in your web browser to download a PDF or Excel version of the report.
- Launch the GoDaddy Commerce App. You might be prompted to sign in.
- Tap Overview in the lower-left corner.
- Under Performance, swipe left to the Top Seller card and tap it.
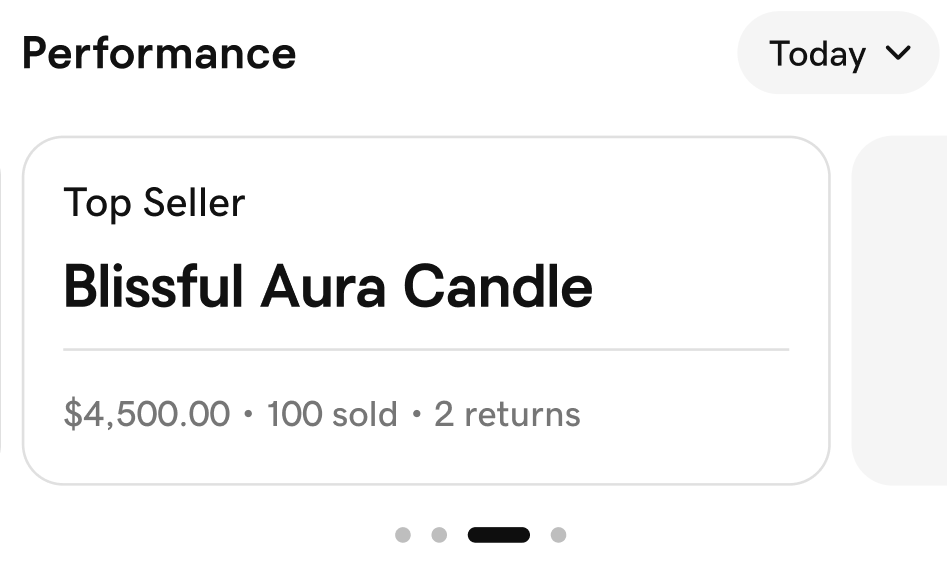
- A list of your top-selling items will appear. In the upper-right corner, toggle between Qty Sold (top sellers by number sold) and Revenue (top sellers by money earned).
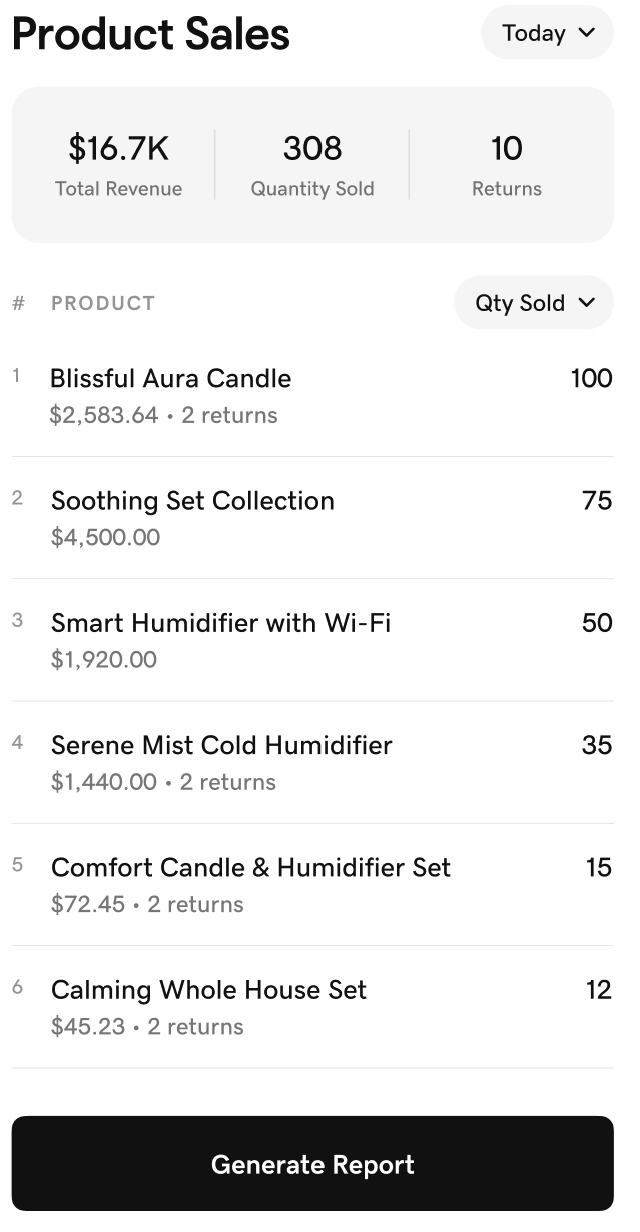
- Below the product listings, tap Generate Report. This will take you to the Reports area of your web browser Dashboard.
- In the Type dropdown menu, ensure that Items Report is selected.
- In the Start and End fields, specify the date range for the report.
- Select Generate to pull your report. (This can take a few minutes.)
- You'll receive an email notification when the report is ready. Select the link in the email to return to Reports. The report will appear below your filter selections.
- Select the report to review a summary and breakdown of itemized orders for the selected time period. You can also adjust the report format depending on how you want to use the data:
- To download the report in Excel, select Excel. You can filter the report data in Excel by different variables (for example, transactions processed by a specific employee).
- To download the report in PDF format, select PDF (if available).
- Use the filters above the report list (under Report History) to locate a previously generated report based on the report type and/or the date the report was generated.
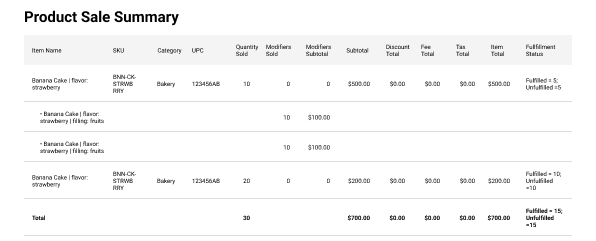
The product sales report includes several sections. At the top, there's a Product Sale Summary section that displays aggregated information per stock-keeping unit (SKU). Besides Item Name, Category and UPC (Universal Product Code), for each SKU there are columns for Quantity Sold, Modifiers Sold and Fulfillment Status (fulfiller or unfulfilled) as well as for Modifiers Subtotal, Subtotal, Discount Total, Fee Total, Tax Total, and Item Total in dollar amount. At the bottom of this section, there's a row that displays Total amounts for each column.
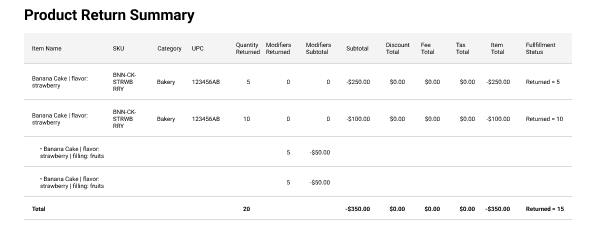
The Product Return Summary section displays the same information but for the returned products.
Below, there are Product Sales Details and Product Returns Details sections, that display the list of all sold or returned items with additional details for each.

When the report is exported to Excel, each section is displayed as a tab in the Excel sheet.